
Clouds, Aerosols & Built Environment
[1]
Real-time forecasting of solar radiation posses several benefits and has huge potential for industrial applications. However, the intermittent nature of solar radiation makes it difficult to forecast accurately. Cloud cover is one of the major influencing factors of solar radiation. Thus, forecasting cloud motion effectively can help to improve the accuracy of short-term solar radiation forecasts. In this study, a novel Multi-Layer Cloud Motion Vector (referred as 3D-CMV) forecasting technique was introduced, which combined with the fast radiative transfer model (FRTM) produces forecasts up to 3 h ahead at 15 min intervals over 5km 5km grids across Europe and North Africa. The cloud microphysics obtained from the Support to Nowcasting and Very Short Range Forecasting (SAFNWC) of the European Organisation for the Exploitation of Meteorological Satellites (EUMETSAT) was used as input to the forecasting system. The results obtained improvements in forecasts as compared to the conventional cloud motion vector techniques, across all seasons and sky conditions. Comparisons against ground-based measurements from the Baseline Surface Radiation Network (BSRN) revealed an overall maximum percentage difference of less than 12%, bias under -20 Wm−2 and a root mean square error (RMSE) under 80 Wm−2. Performance evaluations of Multi-Layer Cloud Motion Vector has been performed against several state-of-the-art techniques and presented in this study. Short-term solar energy forecasting has an established market and rising demand. Accurate forecasts from Multi-Layer CMV hence pose a high potential for real world applications.
[2]
We examine the impact of atmospheric aerosols and clouds on the surface solar radiation and solar energy at Nainital, a high-altitude remote location in the central Gangetic Himalayan region (CGHR). For this purpose, we exploited the synergy of remote-sensed data in terms of ground-based AERONET Sun Photometer and satellite observations from the MODerate Resolution Imaging Spectroradiometer (MODIS) and the Meteosat Second Generation (MSG), with radiative transfer model (RTM) simulations and 1 day forecasts from the Copernicus Atmosphere Monitoring Service (CAMS). Clouds and aerosols are one of the most common sources of solar irradiance attenuation and hence causing performance issues in the photovoltaic (PV) and concentrated solar power (CSP) plant installations. The outputs of RTM results presented with high accuracy under clear, cloudy sky and dust conditions for global horizontal (GHI) and beam horizontal irradiance (BHI). On an annual basis the total aerosol attenuation was found to be up to 105 kWh m−2 for the GHI and 266 kWh m−2 for BHI, respectively, while the cloud effect is much stronger with an attenuation of 245 and 271 kWh m−2 on GHI and BHI. The results of this study will support the Indian solar energy producers and electricity handling entities in order to quantify the energy and financial losses due to cloud and aerosol presence.
[3]
Cyprus plans to drastically increase the share of renewable energy sources from 13.9% in 2020 to 22.9% in 2030. Solar energy can play a key role in the effort to fulfil this goal. The potential for production of solar energy over the island is much higher than most of European territory because of the low latitude of the island and the nearly cloudless summers. In this study, high quality and fine resolution satellite retrievals of aerosols and dust, from the newly developed MIDAS climatology, and information for clouds from CM SAF are used in order to quantify the effects of aerosols, dust, and clouds on the levels of surface solar radiation for 2004–2017 and the corresponding financial loss for different types of installations for the production of solar energy. Surface solar radiation climatology has also been developed based on the above information. Ground-based measurements were also incorporated to study the contribution of different species to the aerosol mixture and the effects of day-to-day variability of aerosols on SSR. Aerosols attenuate 5–10% of the annual global horizontal irradiation and 15–35% of the annual direct normal irradiation, while clouds attenuate 25–30% and 35–50% respectively. Dust is responsible for 30–50% of the overall attenuation by aerosols and is the main regulator of the variability of total aerosol. All-sky annual global horizontal irradiation increased significantly in the period of study by 2%, which was mainly attributed to changes in cloudiness.
[4]
The present study focuses on the predictions and verification of these predictions of solar energy using ground-based solar measurements from the Hellenic Network for Solar Energy and the National Observatory of Athens network, as well as solar radiation operational forecasts provided by the MM5 mesoscale model. The evaluation was carried out independently for the different networks, for two forecast horizons (1 and 2 days ahead), for the seasons of the year, for varying solar elevation, for the indicative energy potential of the area, and for four classes of cloud cover based on the calculated clearness index (kt): CS (clear sky), SC (scattered clouds), BC (broken clouds) and OC (overcast). The seasonal dependence presented relative rRMSE (Root Mean Square Error) values ranging from 15% (summer) to 60% (winter), while the solar elevation dependence revealed a high effectiveness and reliability near local noon (rRMSE ∼30%). An increment of the errors with cloudiness was also observed. For CS with mean GHI (global horizontal irradiance) ∼ 650 W/m2 the errors are 8%, for SC 20% and for BC and OC the errors were greater (>40%) but correspond to much lower radiation levels (<120 W/m2) of consequently lower energy potential impact. The total energy potential for each ground station ranges from 1.5 to 1.9 MWh/m2, while the mean monthly forecast error was found to be consistently below 10%.
[5]
The wildfires over the central Indian Himalayan region have attracted the significant attention of environmental scientists. Despite their major and disastrous effects on the environment and air quality, studies on the forest fires’ impacts from a renewable energy point of view are lacking for this region. Therefore, for the first time, we examine the impact of massive forest fires on the reduction in solar energy production over the Indian subcontinent via remote sensing techniques. For this purpose, we used data from the Moderate Resolution Imaging Spectroradiometer (MODIS), the Cloud-Aerosol Lidar with Orthogonal Polarization (CALIPSO), the Satellite Application Facility on support to Nowcasting/Very Short-Range Forecasting Meteosat Second Generation (SAFNWC/MSG) in conjunction with radiative transfer model (RTM) simulation, in addition to 1-day aerosol forecasts from the Copernicus Atmosphere Monitoring Service (CAMS). The energy production during the first quarter of 2021 was found to reach 650 kWh/m2 and the revenue generated was about INR (Indian rupee) 79.5 million. During the study period, the total attenuation due to aerosols and clouds was estimated to be 116 and 63 kWh/m2 for global and beam horizontal irradiance (GHI and BHI), respectively. The financial loss due to the presence of aerosols was found to be INR 8 million, with the corresponding loss due to clouds reaching INR 14 million for the total Indian solar plant’s capacity potential (40 GW). This analysis of daily energy and financial losses can help the grid operators in planning and scheduling power generation and supply during the period of fires. The findings of the present study will drastically increase the awareness among the decision makers in India about the indirect effects of forest fires on renewable energy production, and help promote the reduction in carbon emissions and greenhouse gases in the air, along with the increase in mitigation processes and policies.
[6]
This study estimates the radiative forcing by biomass burning and dust aerosols over the Indian subcontinent, with emphasis on the Indo-Gangetic Plains (IGP) during the period from January 2021 to April 2021, based on multiple satellite and reanalysis datasets. In this respect, we used retrievals from the Moderate Resolution Spectroradiometer (MODIS) and the Cloud-Aerosol Lidar and Infrared Pathfinder Satellite Observation (CALIPSO) system, as well as reanalysis data from the Goddard Earth Observing System, version 5 (GEOS-5), the Modern-Era Retrospective analysis for Research and Applications, version 2 (MERRA-2), the Copernicus Atmosphere Monitoring Service (CAMS), and ERA-Interim. According to the MERRA-2 and the CAMS, the highest black carbon (BC) concentrations in January 2021 were 7–8 µg m−3, which were significantly lower than measurements performed in main cities along the IGP, such as Patiala, Delhi, and Kanpur. The meteorological data analysis accompanied by the CALIPSO lidar measurements showed that the vertical distribution of total attenuated backscatter (TAB) could reach altitudes of up to ~4–5 km and could be transported over the central Himalayan region. The spatial-averaged daily aerosol radiative forcing (ARF) values over the Indian subcontinent from January 2021 to April 2021 were found to range from −51.40 to −6.08 W m−2 (mean of −22.02 ± 9.19 W m−2), while on a monthly basis, the ARF values varied widely, from −146.24 to −1.63 W m−2 (mean of −45.56 ± 22.85 W m−2) over different parts of the study region. Furthermore, the spatial-averaged daily BC radiative forcing ranged from −2.23 to −0.35 (−1.01 ± 0.40 W m−2), while it varied from −15.29 to −0.31 W m−2 (−2.46 ± 2.32 W m−2) over different regions of southern Asia, indicating a rather small contribution to the total aerosol radiative effect and a large presence of highly scattering aerosols. Our findings highlight the importance of growing biomass burning, in light of recent climate change and the rapid decline in air quality over North India and the Indian Ocean.
[7]
The present study focuses on assessment of dust impact on forecasting solar irradiance and energy, during an extreme dust event. We utilize surface-based Aeronet measurements, satellite observations (MODIS and CALIPSO), and ModIs Dust AeroSol (MIDAS) dust database in conjunction with Weather Research and Forecasting (WRF) model simulations, based on inputs from Indian Solar Irradiance Operational System (INSIOS) and Copernicus Atmosphere Monitoring Service (CAMS) forecast. This work presents a novel approach of CAMS aerosol optical depth (AOD) ingestion into WRF model for analyzing dust impact on solar irradiance. The study region is the northwestern part of Indian subcontinent, an area with some of the largest solar power projects in India. A set of three consecutive and deadly dust storms occurred in May 2018 with one having high intensity and values of AOD and dust optical depth reaching up to 2. Dust events of this extent leads to a significant reduction in solar irradiance and affect the capacity of energy exploitation through Photovoltaic installations and Concentrating Solar Power plants due to the solar aerosol-related extinction. The dust plume resulted in an average decrease of 76 W/m and 275 W/m for global horizontal irradiance (GHI) and direct normal irradiance (DNI), respectively, and a maximum reduction of 100 W/m (10%) and 400 W/m (40%) in GHI and DNI, respectively. The proposed methodology can support solar energy producers, for optimum energy production forecasting, management, and maintenance (e.g. soiling) as well as transmission and distribution system operators, taking into account the effect of dust aerosols into their day-to-day market operations.
[8]
This study estimates the impact of dust aerosols on surface solar radiation and solar energy in Egypt based on Earth Observation (EO) related techniques. For this purpose, we exploited the synergy of monthly mean and daily post processed satellite remote sensing observations from the MODerate resolution Imaging Spectroradiometer (MODIS), radiative transfer model (RTM) simulations utilizing machine learning, in conjunction with 1-day forecasts from the Copernicus Atmosphere Monitoring Service (CAMS). As cloudy conditions in this region are rare, aerosols in particular dust, are the most common sources of solar irradiance attenuation, causing performance issues in the photovoltaic (PV) and concentrated solar power (CSP) plant installations. The proposed EO-based methodology is based on the solar energy nowcasting system (SENSE) that quantifies the impact of aerosol and dust on solar energy potential by using the aerosol optical depth (AOD) in terms of climatological values and day-to-day monitoring and forecasting variability from MODIS and CAMS, respectively. The forecast accuracy was evaluated at various locations in Egypt with substantial PV and CSP capacity installed and found to be within 5–12% of that obtained from the satellite observations, highlighting the ability to use such modelling approaches for solar energy management and planning (M&P). Particulate matter resulted in attenuation by up to 64–107 kWh/m2 for global horizontal irradiance (GHI) and 192–329 kWh/m2 for direct normal irradiance (DNI) annually. This energy reduction is climatologically distributed between 0.7% and 12.9% in GHI and 2.9% to 41% in DNI with the maximum values observed in spring following the frequent dust activity of Khamaseen. Under extreme dust conditions the AOD is able to exceed 3.5 resulting in daily energy losses of more than 4 kWh/m2 for a 10 MW system. Such reductions are able to cause financial losses that exceed the daily revenue values. This work aims to show EO capabilities and techniques to be incorporated and utilized in solar energy studies and applications in sun-privileged locations with permanent aerosol sources such as Egypt.
[9]
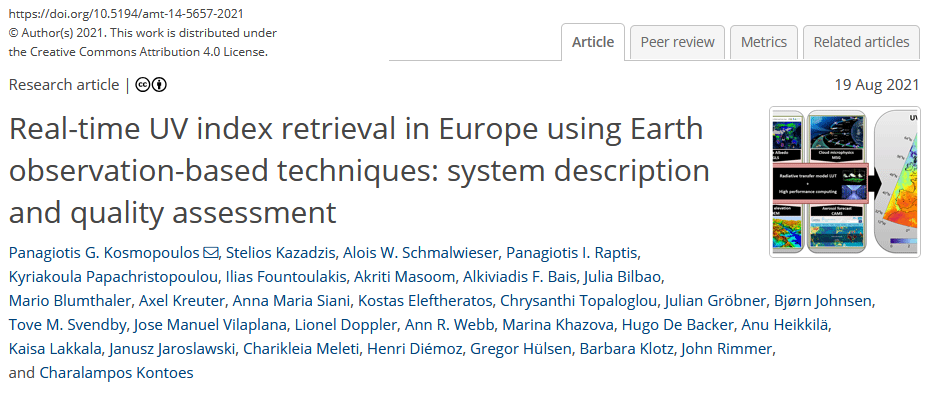
This study introduces an Earth observation (EO)-based system which is capable of operationally estimating and continuously monitoring the ultraviolet index (UVI) in Europe. UVIOS (i.e., UV-Index Operating System) exploits a synergy of radiative transfer models with high-performance computing and EO data from satellites (Meteosat Second Generation and Meteorological Operational Satellite-B) and retrieval processes (Tropospheric Emission Monitoring Internet Service, Copernicus Atmosphere Monitoring Service and the Global Land Service). It provides a near-real-time nowcasting and short-term forecasting service for UV radiation over Europe. The main atmospheric inputs for the UVI simulations include ozone, clouds and aerosols, while the impacts of ground elevation and surface albedo are also taken into account. The UVIOS output is the UVI at high spatial and temporal resolution (5 km and 15 min, respectively) for Europe (i.e., 1.5 million pixels) in real time. The UVI is empirically related to biologically important UV dose rates, and the reliability of this EO-based solution was verified against ground-based measurements from 17 stations across Europe. Stations are equipped with spectral, broadband or multi-filter instruments and cover a range of topographic and atmospheric conditions. A period of over 1 year of forecasted 15 min retrievals under all-sky conditions was compared with the ground-based measurements. UVIOS forecasts were within ±0.5 of the measured UVI for at least 70 % of the data compared at all stations. For clear-sky conditions the agreement was better than 0.5 UVI for 80 % of the data. A sensitivity analysis of EO inputs and UVIOS outputs was performed in order to quantify the level of uncertainty in the derived products and to identify the covariance between the accuracy of the output and the spatial and temporal resolution and the quality of the inputs. Overall, UVIOS slightly overestimated the UVI due to observational uncertainties in inputs of cloud and aerosol. This service will hopefully contribute to EO capabilities and will assist the provision of operational early warning systems that will help raise awareness among European Union citizens of the health implications of high UVI doses.
[10]
This study assesses the impact of dust on surface solar radiation focussing on an extreme dust event. For this purpose, we exploited the synergy of AERONET measurements and passive and active satellite remote sensing (MODIS and CALIPSO) observations, in conjunction with radiative transfer model (RTM) and chemical transport model (CTM) simulations and the 1-day forecasts from the Copernicus Atmosphere Monitoring Service (CAMS). The area of interest is the eastern Mediterranean where anomalously high aerosol loads were recorded between 30 January and 3 February 2015. The intensity of the event was extremely high, with aerosol optical depth (AOD) reaching 3.5, and optical/microphysical properties suggesting aged dust. RTM and CTM simulations were able to quantify the extent of dust impact on surface irradiances and reveal substantial reduction in solar energy exploitation capacity of PV and CSP installations under this high aerosol load. We found that such an extreme dust event can result in Global Horizontal Irradiance (GHI) attenuation by as much as 40–50 % and a much stronger Direct Normal Irradiance (DNI) decrease (80–90 %), while spectrally this attenuation is distributed to 37 % in the UV region, 33 % in the visible and around 30 % in the infrared. CAMS forecasts provided a reliable available energy assessment (accuracy within 10 % of that obtained from MODIS). Spatially, the dust plume resulted in a zonally averaged reduction of GHI and DNI of the order of 150 W m−2 in southern Greece, and a mean increase of 20 W m−2 in the northern Greece as a result of lower AOD values combined with local atmospheric processes. This analysis of a real-world scenario contributes to the understanding and quantification of the impact range of high aerosol loads on solar energy and the potential for forecasting power generation failures at sunshine-privileged locations where solar power plants exist, are under construction or are being planned.
[11]
The effect of two dust events on solar energy has been studied in Europe and North Africa. For analysis, total aerosol and dust optical depth (AOD) in conjunction with solar irradiation and energy data were utilized from Copernicus Atmosphere Monitoring Service (CAMS). The AOD reached ~2.8 and ~1.7 during the dust events (16–19 April 2021 and 15–18 March 2022), respectively. Both events originated in North Africa, reaching the northern parts of Europe and the Black Sea. The energy production of solar photovoltaics in the affected regions was reduced by almost 18–36 GWh, followed by an estimated financial loss of close to 4 million euros.
[12]
We investigate the possibility of estimating global horizontal irradiance (GHI) in parallel to photovoltaic (PV) power production in India using a radiative transfer model (RTM) called libRadtran fed with satellite information on the cloud and aerosol conditions. For the assessment of PV energy production, we exploited one year’s (January–December 2018) ground-based real-time measurements of solar irradiation GHI via silicon irradiance sensors (Si sensor), along with cloud optical thickness (COT). The data used in this method was taken from two different sources, which are EUMETSAT’s Meteosat Second Generation (MSG) and aerosol optical depth (AOD) from Copernicus Atmospheric Monitoring Services (CAMS). The COT and AOD are used as the main input parameters to the RTM along with other ones (such as solar zenith angle, Ångström exponent, single scattering albedo, etc.) in order to simulate the GHI under all sky, clear (no clouds), and clear-clean (no clouds and no aerosols) conditions. This enabled us to quantify the cloud modification factor (CMF) and aerosol modification factor (AMF), respectively. Subsequently, the whole simulation is compared with the actual recorded data at four solar power plants, i.e., Kazaria Thanagazi, Kazaria Ceramics, Chopanki, and Bhiwadi in the Alwar district of Rajasthan state, India. The maximum monthly average attenuation due to the clouds and aerosols are 24.4% and 11.3%, respectively. The energy and economic impact of clouds and aerosols are presented in terms of energy loss (EL) and financial loss (FL). We found that the maximum EL in the year 2018 due to clouds and aerosols were 458 kWh m−2 and 230 kWh m−2, respectively, observed at Thanagazi location. The results of this study highlight the capabilities of Earth observations (EO), in terms not only of accuracy but also resolution, in precise quantification of atmospheric effect parameters. Simulations of PV energy production using EO data and techniques are therefore useful for real-time estimates of PV energy outputs and can improve energy management and production inspection. Success in such important venture, energy management, and production inspections will become much easier and more effective.
[13]
This study estimates the photovoltaic (PV) energy production from the rooftop solar plant of the National Institute of Technology Karnataka (NITK) and the impact of clouds and aerosols on the PV energy production based on earth observation (EO)-related techniques and solar resource modeling. The post-processed satellite remote sensing observations from the INSAT-3D have been used in combination with Copernicus Atmosphere Monitoring Service (CAMS) 1-day forecasts to perform the Indian Solar Irradiance Operational System (INSIOS) simulations. NITK experiences cloudy conditions for a major part of the year that attenuates the solar irradiance available for PV energy production and the aerosols cause performance issues in the PV installations and maintenance. The proposed methodology employs cloud optical thickness (COT) and aerosol optical depth (AOD) to perform the INSIOS simulations and quantify the impact of clouds and aerosols on solar energy potential, quarter-hourly monitoring, forecasting energy production and financial analysis. The irradiance forecast accuracy was evaluated for 15 min, monthly, and seasonal time horizons, and the correlation was found to be 0.82 with most of the percentage difference within 25% for clear-sky conditions. For cloudy conditions, 27% of cases were found to be within ±50% difference of the percentage difference between the INSIOS and silicon irradiance sensor (SIS) irradiance and it was 60% for clear-sky conditions. The proposed methodology is operationally ready and is able to support the rooftop PV energy production management by providing solar irradiance simulations and realistic energy production estimations.
[14]
This paper investigates the effect of clouds, aerosols and urban building-related shadowing effects on rooftop solar energy potentials for actual atmospheric conditions on urban rooftops, using two municipalities in Athens, Greece as an example. We utilize very high-resolution digital surface models for the computation of clear-sky solar irradiance considering surrounding shadows. For all-sky conditions, cloud and aerosol data from 2012 to 2021 are obtained from the Copernicus Atmosphere Monitoring Service radiation service and the ECMWF Atmospheric Composition Reanalysis 4 product, respectively. The goals are to quantify the effect of solar elevation, the shadowing effect from adjacent buildings and constructions, and the effects of clouds and aerosols on the solar radiation availability on the rooftops and to investigate their interconnections. The spatio-temporal resolution of the analyses ranges from individual rooftop to neighborhood scale (approximately 3000 buildings) and from hourly intervals to a ten-year period. Monthly cloud effect reaches up to 30% or >50 kWh m⁻² in Athens, whereas aerosols and urban shadows generally account for < 5% of reduction in solar radiation received on rooftops in most months. Except in winter months, the aerosol effect is more pronounced than the shadowing effect by up to 8% in August.